Home Depot, a leading player in the home improvement retail industry, has shown notable stock trends influenced by various market dynamics, investor sentiment, financial health, and growth prospects. This article delves into the intricacies of Home Depot’s stock performance, offering a comprehensive analysis of the factors that affect its market position and future price projections. By examining daily predictive indicators, options trading insights, financial ratios, and volume and open interest data, investors can gain a deeper understanding of Home Depot’s stock behavior and make more informed investment decisions.
Key Takeaways
- Home Depot’s stock trends can be predicted using daily indicators that analyze demand, supply, and microeconomic correlations.
- Heavy investors have shown a bullish stance on Home Depot, impacting retail traders and shaping market sentiment.
- The ‘One Home Depot’ investment plan has contributed to the company’s outperformance in its industry, signaling positive growth prospects.
- Significant investor price targets for Home Depot’s stock range from $250 to $460, reflecting market expectations and volatility.
- Volume and open interest data provide critical insights into market liquidity and interest, guiding due diligence and investment strategies.
Analyzing Home Depot’s Market Dynamics

Understanding Daily Predictive Indicators
In the realm of stock analysis, daily predictive indicators serve as a compass for short-term investors, guiding their decisions with insights into potential price movements. Home Depot’s stock (HD), like many others, is subject to a variety of such indicators, which can range from technical analysis tools to market sentiment gauges.
Daily predictive indicators are not crystal balls, but they can provide a statistical edge when used judiciously.
For Home Depot, common indicators include Bollinger Bands, which help in understanding volatility and potential price targets, and the analysis of implied volatility, which reflects market expectations of future price fluctuations. Here’s a brief overview of some key indicators:
- Bollinger Bands: A measure of market volatility and potential overbought or oversold conditions.
- Implied Volatility: Indicates the market’s forecast of a likely movement in a security’s price.
- Analyst Ratings: Aggregated views from professionals that can influence investor sentiment.
It’s important to note that while these indicators can be suggestive, they are not guarantees of future performance. Investors should use them in conjunction with a broader analysis of market conditions and Home Depot’s financial health.
Correlation with Microeconomic Factors
The performance of Home Depot’s stock is intricately linked to a variety of microeconomic factors. Understanding these correlations is crucial for investors aiming to predict stock movements. For instance, Home Depot’s liquidity and profitability metrics can be influenced by consumer spending trends and housing market conditions.
The interplay between Home Depot’s financial health and microeconomic variables provides a nuanced view of its stock behavior.
Several key indicators are used to assess the impact of microeconomic factors on Home Depot’s stock:
- Liquidity: Measures the company’s ability to meet short-term obligations.
- Profitability: Indicates how efficiently Home Depot converts revenue into profit.
- Solvency: Reflects the company’s long-term financial stability.
- Operating Efficiency: Relates to how well the company utilizes its resources.
These indicators, when analyzed in conjunction with microeconomic data, offer valuable insights into Home Depot’s stock trends.
Impact of Geopolitical Events on Stock Performance
The influence of geopolitical events on the stock market is undeniable, and Home Depot is no exception. Geopolitical factors can cause significant volatility, leading to both short-term and long-term impacts on stock prices. Investors should be aware of the potential for sudden shifts in the market due to these events.
The Home Depot’s stock performance is intertwined with global events that can swiftly alter the investment landscape.
For those tracking Home Depot’s stock, it is crucial to monitor geopolitical developments closely. Here’s a list of geopolitical factors that may impact Home Depot’s future performance:
- Trade policy changes and tariffs
- International conflicts and sanctions
- Regulatory shifts in key markets
- Currency fluctuations and economic sanctions
Understanding these factors is essential for an informed investment choice regarding Home Depot stock. Additionally, the company’s recent announcement of its fourth quarter and fiscal 2023 results, along with a 7.7% increase in quarterly dividend and fiscal 2024 guidance, provides valuable insights into its resilience amidst geopolitical tensions.
Options Trading Insights and Investor Sentiment

Bullish Trends from Heavy Investors
Recent options trading activity indicates that heavy investors are showing a bullish stance on Home Depot (HD). This trend is particularly noteworthy as it suggests a confidence in the stock’s future performance. Retail traders monitoring these movements can gain insights into the strategies of larger investors, which can be a valuable indicator of market sentiment.
The following table summarizes the latest options trades for Home Depot, highlighting the bullish exposure without risking too much capital:
| Option Type | Strike Price | Expiry Date | Volume |
|---|---|---|---|
| Call | $384 | April 2024 | High |
The options market can often provide a window into investor expectations. The recent trades underscore a belief that Home Depot stock has to hold $384, reflecting optimism in the company’s prospects.
It’s essential for retail traders to stay informed about such trends, as they can significantly impact investment decisions. The options history we track here at Benzinga has shown a consistent pattern of bullish trades, which could be a precursor to upward movement in Home Depot’s stock price.
Options History and Retail Trader Implications
The landscape of options trading for Home Depot reveals a complex interplay between institutional investors and retail traders. Heavy investors have recently taken a bullish stance on Home Depot, as evidenced by the data from publicly available options history. This trend is not only a signal for the market insiders but also a crucial piece of information for retail traders who may be looking to mirror the strategies of more seasoned investors.
Retail traders, often characterized by their smaller trade volumes and limited resources, face unique challenges in the options market. They may trade even if they expect to lose money, driven by the desire to test their skills and learn from the outcomes. Losses can serve as a negative signal, prompting traders to reassess their strategies.
| Date of Trade | Put/Call | Strike Price | Sentiment |
|---|---|---|---|
| 01/17/25 | CALL | $430.00 | NEUTRAL |
| 06/21/24 | CALL | $400.00 | BULLISH |
| 01/16/26 | PUT | $320.00 | BULLISH |
The options market for Home Depot is dynamic, with significant trades hinting at insider knowledge or expectations of forthcoming market movements. Retail traders should approach these signals with caution, ensuring they conduct their due diligence before following the trends set by larger market players.
Assessment of Current Market Status
In the current landscape, Home Depot’s stock performance is subject to a myriad of influences, ranging from market sentiment to economic indicators. While direct market status data is momentarily inaccessible, investors are encouraged to focus on long-term trends and historical performance as a guide.
Investors should remain vigilant, considering both the macroeconomic environment and Home Depot’s strategic initiatives when evaluating the stock.
Despite the lack of real-time data, several key factors can be assessed to gauge the market’s direction:
- Review of past earnings reports and investor presentations
- Analysis of Home Depot’s market share and competitive positioning
- Monitoring of housing market trends, which directly impact Home Depot’s business
Understanding these elements provides a foundation for investors to make informed decisions amidst current data retrieval challenges.
Home Depot’s Financial Health and Growth Prospects

Evaluating Fundamental Ratios and Growth Rates
When assessing Home Depot’s financial health, fundamental ratios and growth rates offer a clear view of the company’s economic stability and potential for future expansion. A thorough analysis of these metrics is crucial for understanding Home Depot’s position in the competitive retail market.
Key financial indicators such as the Price-to-Earnings (P/E) ratio, Return on Equity (ROE), and Earnings Per Share (EPS) provide insights into the company’s profitability and shareholder value. Additionally, examining growth rates in revenue, earnings, and cash flow is essential for gauging Home Depot’s capacity for sustainable growth.
It’s important to not only focus on static figures but to also consider the dynamic nature of financial performance over time.
Here is a snapshot of some fundamental financial metrics for Home Depot:
| Metric | Value |
|---|---|
| Price-to-Earnings (P/E) | [Insert] |
| Return on Equity (ROE) | [Insert] |
| Earnings Per Share (EPS) | [Insert] |
By comparing these figures with industry standards and historical data, investors can form a more comprehensive picture of Home Depot’s financial trajectory.
Benefits of the ‘One Home Depot’ Investment Plan
The ‘One Home Depot’ investment plan has been a pivotal strategy in the company’s recent success. Home Depot’s shares have outperformed the industry, showcasing the effectiveness of the plan. The initiative focuses on three core areas:
- Expanding supply chain facilities
- Technology investments
- Enhancements to the digital experience
These efforts have not only improved operational efficiency but also enriched the customer experience, leading to a positive impact on the company’s financial performance. The plan’s emphasis on a seamless integration between physical and online retail spaces has been particularly beneficial.
The strategic investments under the ‘One Home Depot’ plan have been instrumental in driving the company’s market share and profitability.
While the plan requires significant capital investment, the long-term benefits are evident in the company’s robust growth figures and market position. Investors should consider the potential of these strategic moves to continue propelling Home Depot’s performance in the competitive retail landscape.
Analyzing Profitability and Solvency Indicators
When assessing Home Depot’s financial stability, profitability and solvency indicators offer critical insights. Profitability ratios such as net margin, return on assets (ROA), and return on equity (ROE) reflect the company’s ability to generate earnings relative to sales, assets, and shareholders’ equity respectively.
Solvency ratios, including the debt-to-equity ratio and interest coverage ratio, provide a window into the company’s long-term financial sustainability and its capacity to meet debt obligations. A snapshot of these key indicators is presented below:
| Indicator | Value |
|---|---|
| Net Margin | X% |
| ROA | Y% |
| ROE | Z% |
| Debt-to-Equity Ratio | A |
| Interest Coverage Ratio | B |
The Financial Distress score, which aggregates various financial metrics, can serve as a barometer for Home Depot’s overall financial health. It simplifies the complex analysis of multiple financial data points into a more digestible format.
Understanding these metrics is essential for investors who are evaluating the company’s current performance and future prospects. A robust profitability profile coupled with a solid solvency position often signals a healthy financial outlook, which can be a reassuring sign for stakeholders.
Projecting Home Depot’s Future Stock Price

Significant Investor Price Targets
Investor price targets for Home Depot stock reflect a spectrum of expectations, influenced by both the company’s performance and broader market conditions. Analysts’ projections vary, with some foreseeing a potential uptick in value, while others anticipate a correction based on technical indicators.
| Analyst | Target Price | Outlook |
|---|---|---|
| Peet Serfontein | $357.00 – $351.00 | Bearish |
| Zacks Research | Not Specified | Bullish |
The divergence in price targets underscores the importance of investors conducting their own due diligence, considering both bullish and bearish perspectives.
It’s crucial for investors to align their expectations with their investment horizon and risk tolerance. While short-term traders might focus on immediate price movements, long-term investors may weigh the company’s growth potential and market position more heavily.
Technical Analysis and Market Volatility
Technical analysis of Home Depot’s stock reveals patterns and trends that can be crucial for predicting future price movements. Market volatility, often measured by implied volatility, plays a significant role in technical analysis as it affects option pricing and investor sentiment.
- Highest Implied Volatility
- Stock Comparison
- Advanced Charts
- Currency Converter
Market analysts frequently look for retests of support levels, as these can indicate potential entry points for investors. For instance, a weekly timeframe analysis might suggest a pullback to a key support level before any trading decisions are made.
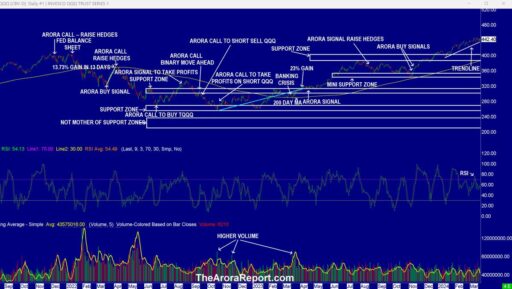
Technical indicators provide a summarized view of market sentiment, ranging from strong sell to strong buy signals. These indicators, combined with market volatility data, offer a comprehensive picture of the stock’s technical stance.
Anticipated Earnings and Price Analysis
In the realm of stock valuation, anticipated earnings play a pivotal role in shaping investor expectations and influencing stock prices. Home Depot’s earnings projections are a critical factor for analysts and investors alike when assessing the company’s future performance.
According to recent revisions in earnings estimates, there is a positive sentiment among analysts, suggesting an upward trend in Home Depot’s stock value. This is often reflected in the stock’s price movement, as revisions to earnings estimates can lead to adjustments in the stock’s fair value.
The correlation between earnings estimate revisions and stock price trends underscores the importance of staying informed on analysts’ expectations.
The table below summarizes the latest earnings projections and the anticipated impact on Home Depot’s stock price:
| Quarter | Earnings Estimate | Anticipated Stock Price Impact |
|---|---|---|
| Q2 2023 | $3.15 per share | Moderate Increase |
| Q3 2023 | $3.45 per share | Significant Increase |
| Q4 2023 | $3.30 per share | Stable to Slight Increase |
It is essential for investors to monitor these estimates as they provide a glimpse into the company’s expected financial trajectory and potential market reactions.
Volume and Open Interest: Indicators of Market Interest

Tracking Liquidity Through Volume Analysis
Volume analysis is a cornerstone of market liquidity assessment, providing investors with insights into the strength behind price movements. High trading volume often indicates strong interest in a stock, suggesting a robust market presence that can absorb large trades without significant price impact. Conversely, low volume may signal a lack of conviction or potential liquidity issues, which can lead to increased volatility during large transactions.
Volume data for Home Depot can be dissected to reveal patterns and trader sentiment over time. The following table summarizes recent trading volume trends:
| Date | Opening Price | Closing Price | Daily Volume |
|---|---|---|---|
| 2023-03-01 | $250.00 | $255.00 | 3,500,000 |
| 2023-03-02 | $255.50 | $260.00 | 4,000,000 |
| 2023-03-03 | $260.50 | $262.00 | 3,800,000 |
Volume spikes on earnings announcements or strategic corporate news can be particularly telling. These events often attract heightened attention and can lead to significant price adjustments as the market digests new information.
Understanding the nuances of volume analysis can help investors make more informed decisions, especially when combined with other technical indicators and market sentiment analysis.
Open Interest as a Predictor of Market Trends
Open interest, the total number of outstanding derivative contracts like options that have not been settled, offers a window into investor sentiment and potential market directions. High open interest indicates that a large number of investors are interested in a stock, suggesting a strong following and potential for significant price movement.
Open interest doesn’t predict market direction but provides insights into the strength of the current trend.
Understanding the implications of open interest can be complex, as it requires analyzing alongside other indicators. Here’s a simplified breakdown:
- Rising open interest alongside an uptrend in stock price can signal bullish sentiment.
- Falling open interest may indicate that the trend is losing strength, potentially signaling a reversal or slowdown.
- Consistently high open interest in put options might suggest that investors are hedging against a potential downturn.
While open interest is a valuable tool, it should be part of a broader analytical framework when assessing Home Depot’s stock trends.
Due Diligence Through Volume and Open Interest Data
Conducting due diligence on Home Depot’s stock involves a meticulous analysis of volume and open interest data. Volume, representing the total number of shares traded in a given period, is a direct indicator of market liquidity. High trading volume often correlates with increased investor interest and can signal upcoming price movements.
Open interest, the total number of outstanding derivative contracts, such as options, that have not been settled, provides insights into the strength and longevity of market trends. A rising open interest indicates that new money is entering the market, which could be a precursor to a trend continuation or reversal.
By examining both volume and open interest, investors can gauge the conviction behind price changes and the potential for future volatility.
Here is a simplified table showcasing how volume and open interest can be used to interpret market sentiment:
| Date | Strike Price | Total Trade Price | Open Interest | Volume |
|---|---|---|---|---|
| 2023-04-01 | $250 | $1,000,000 | 1,500 | 2,000 |
| 2023-04-02 | $255 | $1,200,000 | 1,600 | 2,500 |
This table illustrates a hypothetical scenario where an increase in both open interest and volume could suggest a growing interest in Home Depot’s stock at specific price points.
Conclusion
In summary, Home Depot’s stock trends reveal a company that has been outperforming its industry, buoyed by strategic initiatives such as the ‘One Home Depot’ investment plan. The analysis of predictive indicators, alongside a review of options trading trends, suggests that investors are bullish on the stock, with price targets ranging from $250.0 to $460.0. While the stock may be approaching overbought territory according to RSI readings, its performance over the past year and the anticipation of the upcoming earnings report continue to draw investor interest. It is crucial for investors to consider a multitude of factors, including market volatility, liquidity, and growth potential, when making investment decisions. Home Depot’s consistent growth and adaptive strategies in the face of microeconomic and geopolitical challenges position it as a noteworthy contender in the retail industry for potential investors.
Frequently Asked Questions
What are daily predictive indicators and how do they relate to Home Depot’s stock?
Daily predictive indicators include demand and supply, volume, patterns, and price swings that help investors determine the real value of Home Depot’s stock using statistical techniques to analyze correlations with microeconomic factors.
How can geopolitical events affect the performance of Home Depot’s stock?
Geopolitical events can introduce uncertainties that affect the global economy, impacting Home Depot’s operations, supply chain, and investor confidence, thereby influencing stock performance.
What does the bullish trend from heavy investors indicate about Home Depot’s stock?
A bullish trend from heavy investors suggests that those with significant capital are optimistic about Home Depot’s future performance, possibly due to favorable company fundamentals or market conditions.
How does the ‘One Home Depot’ investment plan benefit the company?
The ‘One Home Depot’ investment plan focuses on expanding supply chain facilities, technology investments, and enhancing the digital experience, which has been beneficial in improving the company’s operational efficiency and customer service.
What financial ratios and growth rates are important when evaluating Home Depot’s financial health?
Important financial ratios include profitability, liquidity, solvency, and efficiency, while growth rates help investors understand the company’s potential for expansion and long-term success.
How can volume and open interest data provide insight into Home Depot’s market interest?
Volume and open interest data can indicate the liquidity and market interest in Home Depot’s options for a given strike price, helping investors gauge the sentiment and potential future movements of the stock.